Projected Dividend Income, Payment Timing, Yield, and Yield on Cost Explained
A plain-language guide to the income figures that can help you understand a dividend portfolio and plan around expected cash flow.
Dividend portfolios are often described with a few numbers: yield, annual income, payment frequency, and yield on cost. These figures answer different questions. Understanding the difference can make a portfolio view more useful, especially when you are planning around when income may arrive rather than looking only at the current account balance.
What is projected dividend income?
Projected dividend income is an estimate of how much a position or portfolio might receive if the saved dividend amount and schedule continue. A simple annual estimate is:
For example, 100 shares with an estimated annual dividend of $1.00 per share would produce a projected annual income of $100. A tracker can also express that estimate as daily or monthly income so the total is easier to compare with a household budget or other income sources.
The estimate depends on the information saved for the position. If the dividend amount, share count, or schedule is wrong, the projected total will also be wrong. That is why reviewing imported data and completing missing dividend details is an important part of setup.
What does payment timing mean?
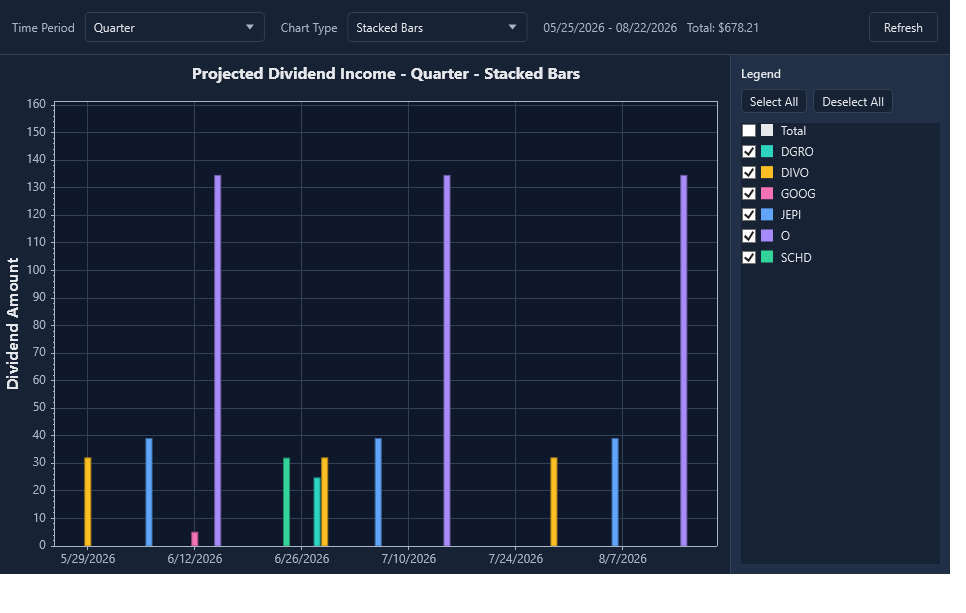
Payment timing describes when expected income may arrive. A monthly payer may contribute to every month, while a quarterly payer may contribute only four times a year. Two portfolios can have the same annual projected income but very different monthly patterns.
A payment-timing view can help you see:
- Which months or quarters have more expected income
- Which positions contribute to a particular payment period
- Whether income is spread across the year or concentrated in a few periods
- Where a portfolio may have a gap between expected payments
What is dividend yield?
Dividend yield compares estimated annual dividend income with the current market value of the position. A simplified calculation is:
Suppose a position is worth $5,000 and its estimated annual dividend is $100. Its current yield is 2%. Yield changes when the market value changes, even if the dividend amount stays the same.
Yield is useful for comparing the income produced by current portfolio value, but it should not be used alone to decide whether an investment is suitable. A high yield can reflect a falling share price, a temporary distribution, or a business whose dividend may not be sustainable.
What is yield on cost?
Yield on cost compares estimated annual dividend income with the original cost basis instead of the current market value:
Imagine the same position produces $100 of estimated annual income. If the original cost basis was $3,500, the yield on cost is about 2.86%, even though the current yield on a $5,000 value is 2%.
Yield on cost can help you understand the income return on the money originally invested. It is a historical perspective, though, and it does not tell you whether the position is attractive at today’s price. Current yield and yield on cost answer different questions.
How the figures work together
A useful portfolio view keeps these figures together:
- Projected income: How much income might the saved positions produce?
- Payment timing: When might that income arrive?
- Current yield: How much estimated income does the current portfolio value represent?
- Yield on cost: How much estimated income does the original cost basis represent?
Looking at all four can reveal different aspects of the same portfolio. A position may have a modest current yield but a higher yield on cost because its dividend has grown since purchase. Another position may show a high current yield because its price has fallen, which deserves closer review rather than automatic approval.
Using these figures in StockTracker
StockTracker keeps daily, monthly, and yearly income estimates visible in the main portfolio view. It also includes a projected dividend-income chart for reviewing payment periods and position contributions. Portfolio files stay local on the computer, and the app does not require an online portfolio account.
Free mode supports up to five positions. The paid version is a $20 one-time purchase that unlocks unlimited positions. Free updates are provided to both free-mode and paid users.
See your own income pattern
Try StockTracker with a small portfolio, review the income figures, and upgrade when you need unlimited positions.
Try StockTracker free Buy the full versionThe Windows installer is not currently code-signed. Read the installation guidance before opening it.