How to Track Dividend Income on Windows Without an Online Portfolio Account
A practical workflow for answering two useful questions: how much income might a portfolio produce, and when might those payments arrive?
Watch the StockTracker demo for a short walkthrough of the portfolio view, projected income chart, and dividend-detail review workflow.
Portfolio value is useful, but it does not always answer the questions that matter when you are planning around income. A dividend-focused view should make it easy to see the expected income from each holding, the total for a month or year, and the timing pattern behind that total.
For some investors, a Windows desktop app is a better fit than an online portfolio service. You can keep the portfolio file on your own computer, work without creating another account, and still use charts and market-data tools when you need them.
What a useful dividend-income view should show
A basic portfolio table becomes much more useful for income planning when it keeps these details visible:
- Estimated daily, monthly, and yearly dividend income
- Dividend frequency, such as monthly, quarterly, or yearly
- The next estimated payment timing for each position
- Current value, purchase cost, gains, yield, and yield on cost
- A chart that shows how expected payments are distributed across a month, quarter, or year
This combination helps answer both the total-income question and the timing question. It can also make concentration easier to notice: one holding may contribute a large share of expected income even if it represents a smaller share of portfolio value.
A simple Windows workflow
1. Start with the positions you already own
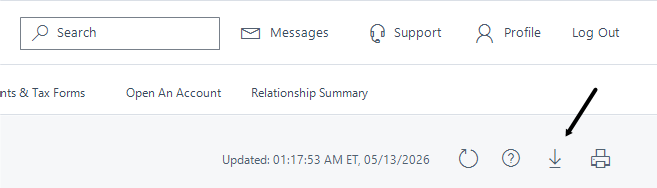
StockTracker can accept manually entered positions, a dedicated Charles Schwab Positions CSV, or mapped position data from CSV and Excel files. Starting with a brokerage export can be faster than retyping every symbol and share quantity.
2. Complete the dividend details
Projected income depends on the dividend amount, share count, frequency, and estimated payment date saved for each position. Review imported data and fill in missing details where needed. The application can also help look up suggested dividend information for stock positions.
3. Review the main portfolio view
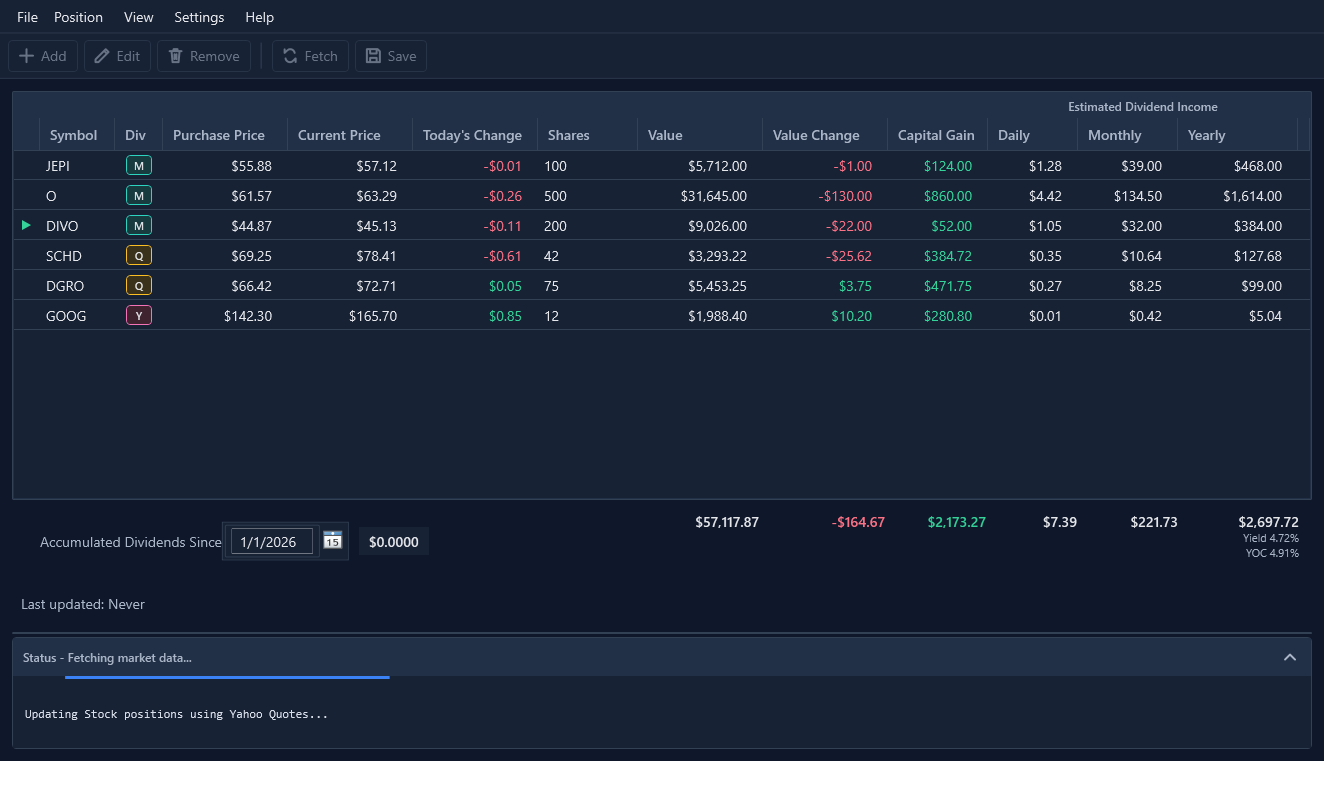
The main table keeps dividend frequency and projected daily, monthly, and yearly income alongside position value and gains. That makes it possible to scan income and portfolio movement together instead of switching between a brokerage page and a separate spreadsheet.
4. Look ahead with the income chart
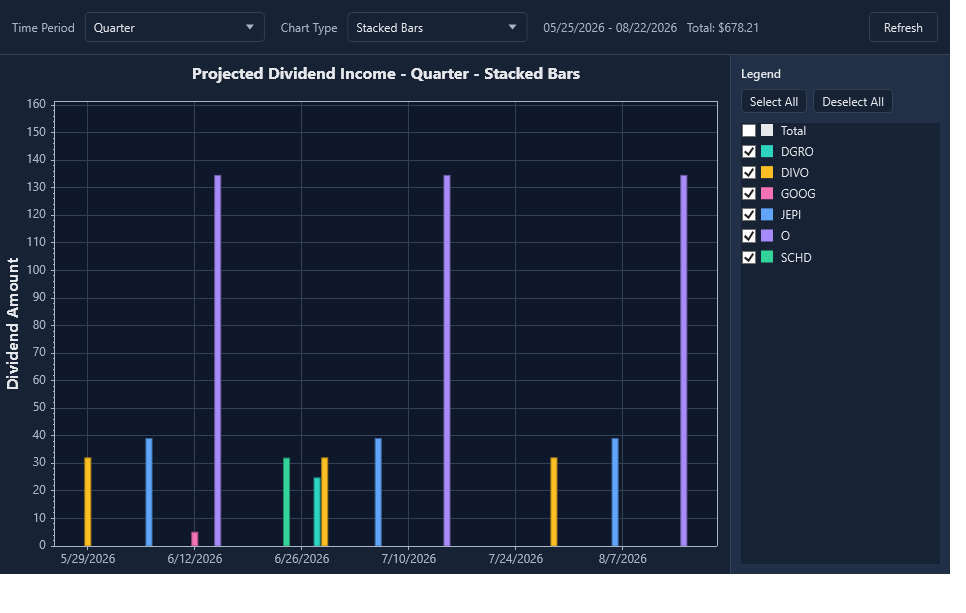
The projected dividend-income chart turns saved schedules into a forward-looking payment view. Use it to compare months or quarters, see which positions contribute to a period, and understand why the annual estimate is distributed the way it is.
5. Keep a read-only view on your phone
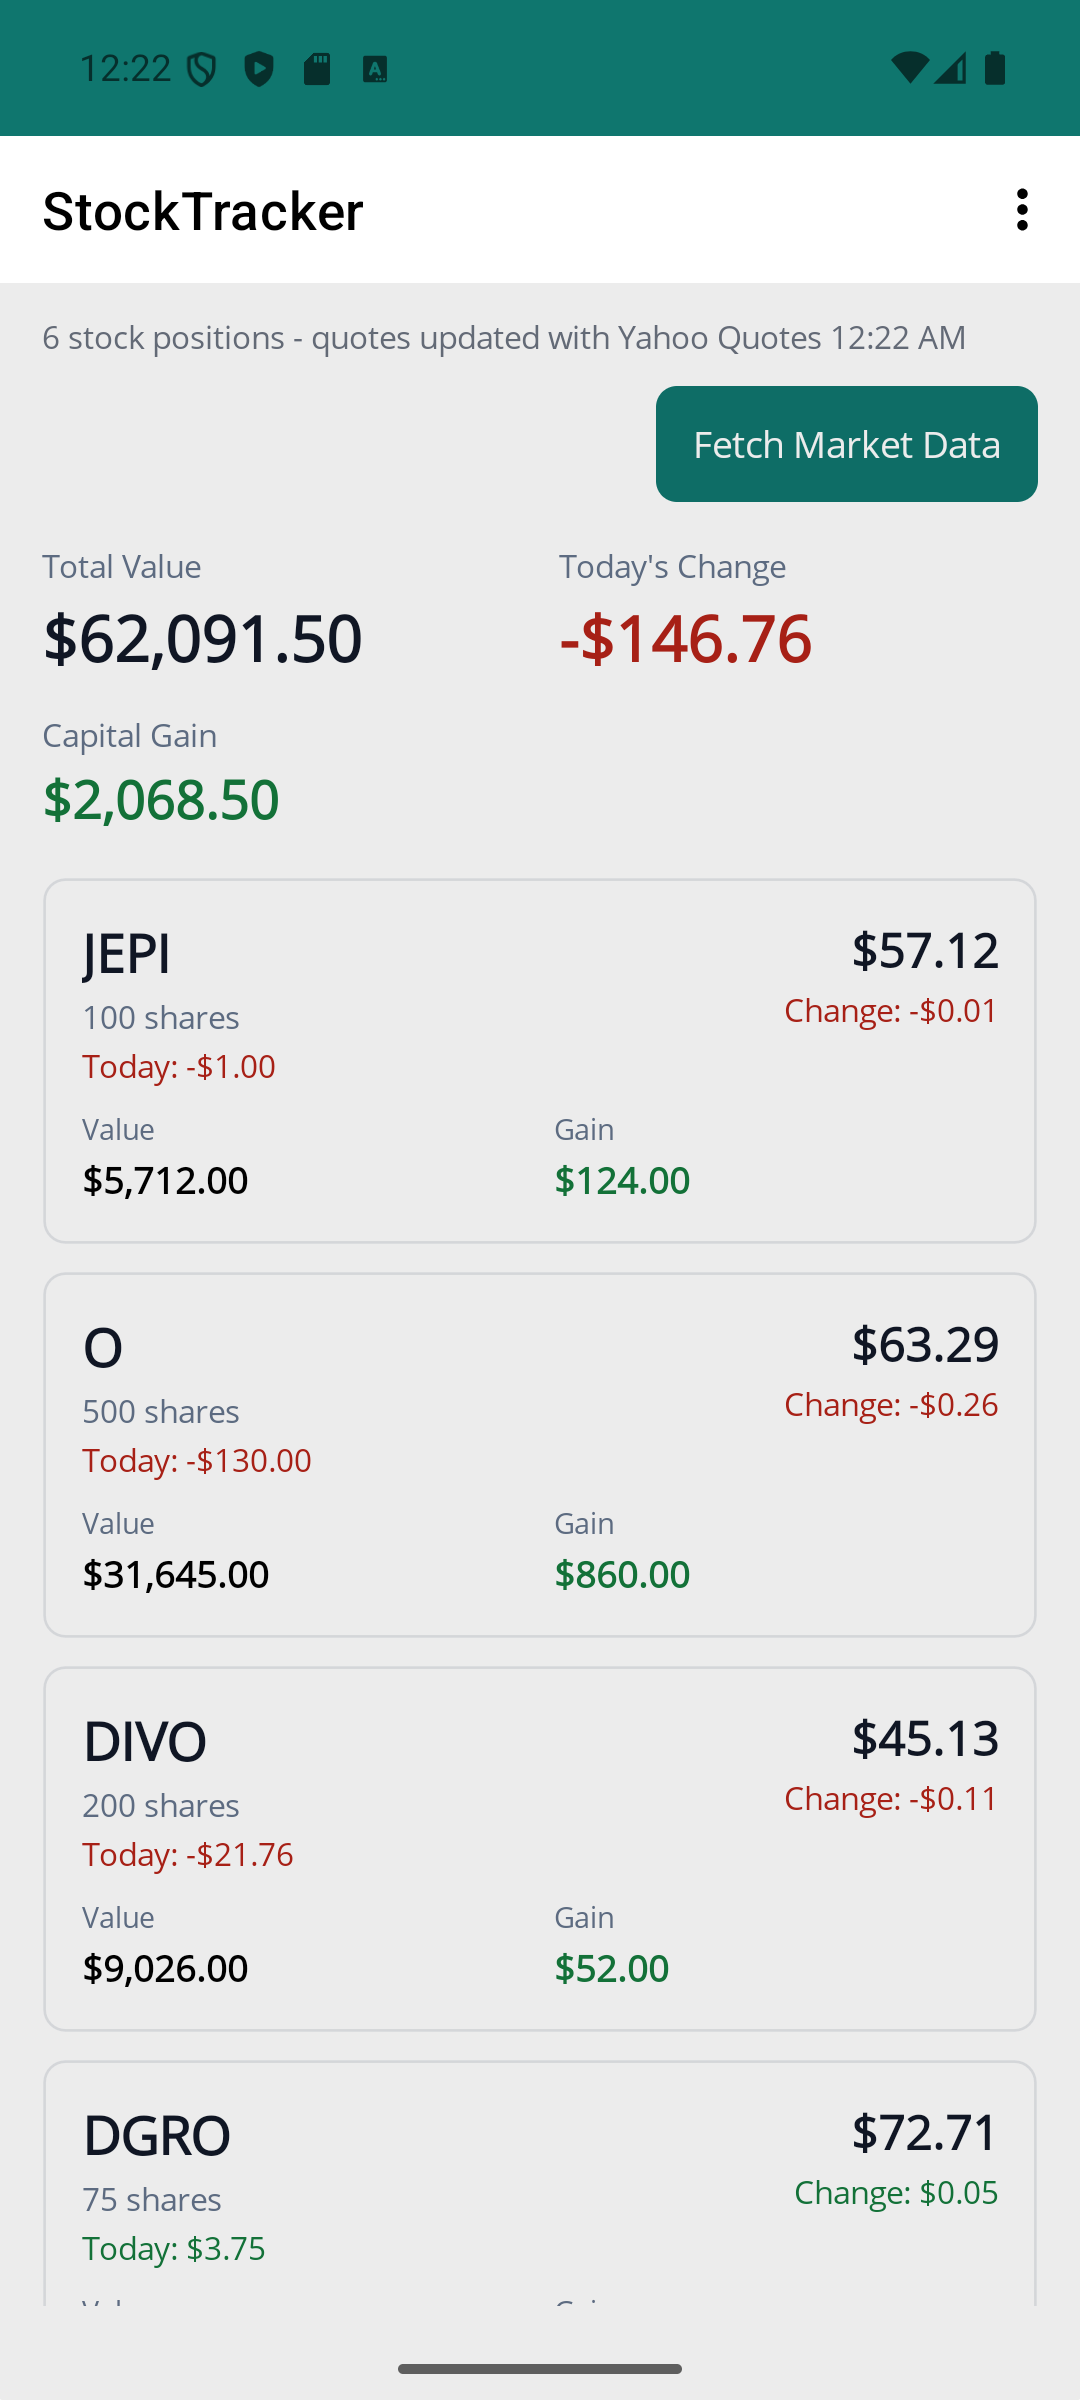
The included Android companion can import a read-only copy of the desktop portfolio over your local network. It is useful for checking totals and positions away from the Windows computer, while the desktop app remains the place where the portfolio is managed.
What StockTracker does—and does not—promise
StockTracker stores portfolio files locally and does not require a StockTracker account or online portfolio service. Internet access is still required when you retrieve market data or check for and download updates.
Free mode supports up to five positions. When a free-mode portfolio contains six or more positions, market-data fetching is disabled for the entire portfolio until positions are reduced or a license is activated. The paid version is a $20 one-time purchase that unlocks unlimited positions. Updates are free for both free-mode and paid users.
These figures are estimates based on saved portfolio information. They are not a promise of future dividends, a performance forecast, or investment advice.
Try the workflow with a small portfolio
Download StockTracker free for up to five positions, then upgrade once when you need unlimited positions.
Try StockTracker free Buy the full versionThe Windows installer is not currently code-signed. Read the installation guidance before opening it.