How to Build a Dividend Payment Calendar from the Portfolio You Already Own
Annual projected income is useful, but a calendar view shows when that income may actually arrive.
Dividend income is rarely distributed evenly across the year. A portfolio can produce a reasonable annual total while still having light months, heavy months, or several payments arriving close together. If you plan around income, seeing the timing pattern can be as useful as seeing the yearly estimate.
Start with the positions you own
A useful calendar begins with a current portfolio. Add positions manually or import a Charles Schwab Positions CSV, a mapped CSV, or an Excel .xlsx file. Review the imported symbols and share quantities before calculating income.
Complete the details behind each estimate
For each income-producing position, a calendar needs enough information to estimate the payment:
- Number of shares
- Dividend amount per share
- Payment frequency, such as monthly or quarterly
- Estimated payment date or month
If one of these values is missing or outdated, the calendar can be incomplete. Check the saved dividend details after an import and after a company changes its distribution.
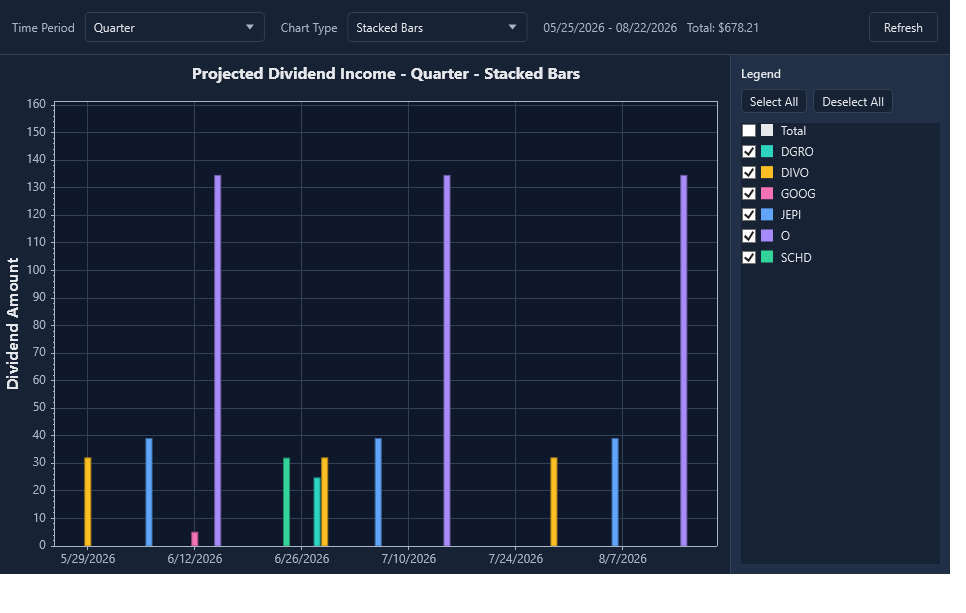
Look for gaps, clusters, and concentration
Once the data is complete, group the expected payments by month, quarter, or year. Three patterns are especially useful to notice:
- Gaps: periods with little or no expected portfolio income
- Clusters: periods where several holdings are expected to pay at once
- Concentration: a small number of positions providing a large share of the expected total
These patterns do not automatically mean that a portfolio needs to change. They simply make the income schedule easier to understand and give you better questions to investigate.
Review the calendar after portfolio changes
A calendar should be refreshed whenever the portfolio changes. Selling a position removes its future estimate. Buying more shares increases the estimate. A dividend increase, reduction, special distribution, or schedule change can also alter the projected pattern.
For a simple review routine:
- Update shares and purchase information after a trade.
- Review the dividend amount and frequency.
- Check the estimated payment timing.
- Refresh supported market data when an internet connection is available.
- Save the portfolio and review the chart again.
Keeping the process simple makes it more likely that the calendar remains useful instead of becoming another neglected spreadsheet.
Use the calendar alongside the income totals
The annual total answers “how much might this portfolio produce?” The calendar answers “when might it arrive?” The monthly and daily figures help translate the yearly estimate into smaller planning units, while the chart shows the pattern behind the numbers.
StockTracker keeps these views in one local Windows application. Free mode supports up to five positions, and the $20 one-time paid version unlocks unlimited positions. Updates are free for both free-mode and paid users.
See your portfolio's payment pattern
Try StockTracker with a small portfolio and use the income chart to see when expected payments may arrive.
Try StockTracker free Buy the full versionThe Windows installer is not currently code-signed. Read the installation guidance before opening it.